Alyssa Kowis, Collegiate Librarian & Librarian Assistant Professor
Kelli Anne Gecawich, Assessment Librarian & Librarian Assistant Professor
Dr. Kristina Clement, Assistant Director of Academic Engagement & Instruction, Collegiate Librarians & Librarian Associate Professor
Kennesaw State University
Introduction
Academic libraries continue to expand outreach and engagement efforts in response to shifting student needs, evolving service models, and persistent challenges in making library value visible. These challenges are often amplified in science, technology, engineering, and math (STEM) focused environments where time constraints, academic workloads, and help-seeking patterns can make traditional outreach programming ineffective. At the same time, academic libraries need outreach and engagement strategies that do not always require a high time commitment from students, or continuous employee mediation, while still generating usable insight that can inform services, collections, and student success initiatives.
This paper examines low-tech, high-visibility passive outreach as a pragmatic response to a central tension in STEM library engagement: the desire for richer insight into students’ library needs and preferences versus the reality that higher-effort or socially exposed outreach methods can suppress participation. Following a brief literature review about academic library outreach, STEM outreach, and passive engagement or micro-assessment strategies, we present two complementary case studies. The first examines #ProjectWhiteboard, a portable whiteboard prompt initiative implemented at the Lane Library on Georgia Southern University’s Armstrong campus, documenting how a simple feedback mechanism evolved into a sustained community-building fixture. The second case study examines the Johnson Library Sticker Survey Project on the Kennesaw State University’s STEM (Marietta) campus, which adapts prompt-based engagement into a sticker “micro-survey” format designed to reduce effort further and broaden participation. Together, these cases demonstrate how pairing an established engagement method with a less-explored micro-survey variant offers practice-informed evidence for sustainable, assessment-minded outreach approaches in STEM-focused library contexts.
Literature Review
Defining and Assessing Academic Library Outreach
Academic library outreach is commonly understood as essential work for librarians, both for connecting users with services and for demonstrating the library’s value in contexts where user-library relationships are not automatic or immediately visible, despite the lack of consensus around a common definition of outreach (Bastone, 2020; Clement, 2024; Diaz, 2019; Metzger & Jackson, 2022; Oakleaf, 2010). Blummer and Kenton’s (2019) synthesis of 174 academic library outreach-focused articles emphasizes outreach functions a core engagement mechanism across academic libraries, while also adding to the ongoing conversation about the absence of a definitive, shared definition of “outreach.” As Blummer and Kenton (2019) note, the definitional ambiguity of outreach as a key function of academic librarianship matters deeply for assessment purposes, as the lack of a common definition can blur goal-setting and dilute assessment efforts. Even with varied definitions, academic library outreach efforts tend to cluster into recognizable patterns, including outreach to targeted groups, specialized programs, and just for fun (Blummer & Kenton, 2019; Farrell & Mastel, 2016).
Del Bosque et al. (2017) examine the gap between awareness of library services and actual use, framing outreach and marketing as a problem of translating general familiarity into specific, behavior-linked understanding. Survey-based comparison of high-use and low-use undergraduate students illustrates a key outreach design implication: feedback mechanisms should intentionally reach beyond the already-engaged users if academic libraries want to understand what prevents non-users or low-users from connecting with services (Del Bosque et al., 2017, p. 15). Farrell and Mastel (2016) argue for outreach assessment to move beyond headcounts and attendance, urging academic libraries to align assessment methods to outreach goals, including awareness-building, relationship-building, or student well-being. Offering a practical categorization of outreach and providing examples of qualitative and quantitative assessment approaches, Farrell and Mastel’s framework is particularly useful for outreach initiatives that may appear light on the surface but still serve meaningful outcomes such as increasing comfort with the library or lowering barriers to help-seeking.
STEM Outreach
Within the broader academic library outreach landscape, outreach to Science, Technology, Engineering, and Math (STEM) students tends to be prioritized and uniquely challenging (Biddle & Gowen, 2023; Duong, 2010; Flash et al., 2017). Biddie and Gowen (2023) examine STEM outreach activities and planning practices in academic libraries, emphasizing that many outreach efforts are implemented through individualized approaches rather than cohesive, large-scale strategy. Highlighting how the COVID-19 era shaped outreach delivery and constraints, Biddie and Gowen discuss the need for adaptability in both outreach programming and expectations. A key implication from Biddie and Gowen’s research is that STEM outreach may benefit from approaches that are sustainable in limited-capacity environments, including methods that can be repeated over time with low staffing burden while still producing meaningful engagement and usable insight.
A complimentary approach to STEM outreach centers relationship-building and listening rather than transactional promotion. Borrego et al. (2020) propose “curiosity as outreach,” describing an outreach model where librarians visit campus spaces without a rigid agenda, prioritizing presence, observation, and conversation. Framing outreach as a method for learning about student needs as well as campus culture can uncover barriers or misconceptions traditional marketing might miss. Borrego et al. (2020) also illustrate a common issue across academic library outreach scholarship: outcomes can be difficult to measure or quantify, and success often depends on local culture and staff capacity. Still, the “curiosity” framing is particularly resonant for STEM outreach contexts where students may not proactively seek library help as readily as other students. Overall, the literature suggests a productive tension in STEM outreach: STEM outreach benefits from intentional planning, but it also benefits from low-pressure, human-centered engagement to reduce barriers and create approachable opportunities for engagement. The tension creates space for outreach strategies that are scalable and sustainable while still fostering relational connection and providing insight into student preferences and behaviors.
Passive Outreach in Academic Libraries
Passive engagement strategies offer a promising route for navigating academic library outreach capacity constraints while still building connection and gathering useful feedback. Owens (2019) frames interactive library spaces as passive outreach, where the environments and experiences invite engagement without requiring an employee-mediated interaction. Using a no-tech/low-tech/high-tech continuum, Owens argues that passive outreach can contribute to student comfort and belonging, with the idea that when students feel “at home” in a space, they may be more likely to engage deeply later in part due to perceived ownership of the space (p. 17). Mehta and Cox (2021) argue that while students often act as though they are at home in academic libraries, the concept of homeness has not always been directly examined. Using Seamon’s five-dimension model of homeness (rootedness, appropriation, regeneration, at-easeness, and warmth), Mehta and Cox demonstrate that students can and do feel “at home” in academic library spaces, and their findings suggest homeness is supported less by novelty and more by practical and affective conditions.
Practice-based examples of passive outreach and engagement in academic libraries often focus on highly visible, participatory tools like whiteboards—resources that are already familiar to students as study tools, but can be repurposed as low-cost, minimal effort engagement and feedback mechanisms. Pruneda et al. (2017) describe a case in which study rooms were painted with whiteboard paint, expanding the capacity for student use and engagement. Their work also details how mobile whiteboards were used not only for student expression, including art, but also for library-led prompts and service visibility, at times amplified through social media via a custom hashtag. Gecawich’s (2024) post-COVID case study similarly frames portable/rolling whiteboards as ever-present, low- to no-cost, minimal effort engagement and feedback tools documenting how #ProjectWhiteboard began as a lightweight mechanism to collect student input and evolved into an ongoing community-building fixture. Gecawich’s implementation details emphasize how placement and perceived visibility shape participation in passive outreach and engagement: when positioned at the circulation desk responses were limited, but moving the whiteboard to a more transitional lobby space increased response volume. Taken together, Pruneda et al. (2017) and Gecawich (2024) provide instructive cases that foreground the practical realities, such as placement, upkeep, and staff workflow, that often determine whether passive outreach and engagement strategies remain sustainable over time. However, whiteboards can offer limited formal outcome assessment that is tied to longer-term shifts in awareness, usage, or learning.
Where whiteboard prompt strategies become especially relevant to assessment is in the micro-survey literature. Camacho et al. (2020) describe a “one question at a time” survey approach implemented through a whiteboard survey at a reference desk. Their case suggests that reducing the time and effort required to respond can increase participation and yield actionable, in-the-moment feedback. Camacho et al.’s (2020) approach to a micro-survey is inherently repeatable: questions can rotate frequently, feedback can be shared visibly, and the method can serve as both outreach, engagement, and assessment. Still the limitations of micro-surveys are important: participation is self-selected, responses are brief, and longer-term impacts are not fully captured, indicating that micro-surveys are most effective when paired with traditional assessment methods or when positioned as a lightweight complement to larger strategies. A related qualitative perspective comes from Sandelli and Cunningham’s (2019) ethnographic use of whiteboards in student-owned or transitional spaces. By placing prompts where students gather and by collecting a large corpus of brief, in-situ responses, Sandelli and Cunningham’s study shows how low-cost, high-visibility prompt strategies can reveal authentic student voices. Similar to Gecawich (2024), Sandelli and Cunningham (2019) emphasize the importance of location in whiteboard surveys, and that even though positioning whiteboards in student-owned spaces may generate different participation patterns and themes than employee-centric spaces, the primary challenge lies in contextualizing short, anonymous responses, which can be difficult to disaggregate by subgroup and connect to change over time. Together, these studies reinforce a recurring theme across passive academic library outreach and engagement scholarship: low-barrier methods can generate participation and insight, but translating the insight into measured outcomes remains a challenge.
Micro-Survey Case Studies
Academic library outreach literature consistently affirms outreach as essential work, yet it also reveals persistent challenges that shape what is feasible and what is measurable. Outreach remains variably defined, often evaluated through proxy measures (e.g., attendance), and complicated by the well-documented gap between awareness of library services and behavior-linked use. The challenges are amplified in STEM contexts, where outreach is often prioritized but constrained by staffing capacity and student unwillingness to engage, making sustainability and low-pressure relationship-building central considerations. Passive outreach and micro-assessment strategies respond to this reality by lowering the cost of participation through visible, low-tech touchpoints that can foster comfort, belonging, and insight. However, existing studies more frequently emphasize implementation and participation than they do sustained program models or connections to longer-term outcomes. To contribute to this gap, the present article offers two complementary case studies of low-tech, high-visibility passive outreach: one examining a portable whiteboard initiative that reflects a more established approach in the literature, and the second examining a sicker survey project, which adapts the whiteboard prompt model into a sticker-based micro-survey designed to reduce effort further and broaden participation. Together the cases document the rationale for each intervention, detail the practical implementation decisions that shaped participation (including placement, visibility, and workflow), and examine the patterns of student response and insight generated over time, providing practice-informed evidence for passive outreach strategies that are both sustainable and assessment-minded in academic library and STEM-focused environments.
#ProjectWhiteboard @ Georgia Southern University
by Kelli Anne Gecawich
Institutional Profile & Project Background
Georgia Southern University is an R2 designated public university, with campuses located in Statesboro, Savannah, Swainsboro and Hinesville, Georgia. The university enrolled 29,633 undergraduate and graduate students in the fall 2025 semester, with 5,168 enrolled on the Armstrong campus in Savannah (Georgia Southern University, 2026). After COVID-19 restrictions were lifted in fall 2021, staff at Lane Library on the Armstrong campus began searching for new ways to gather student feedback. Drawing on published examples from academic libraries, the team piloted a whiteboard survey. What started as a simple feedback tool during the transition to post-pandemic operations evolved into a community-building initiative that has remained a fixture in Lane Library for over 4 years. Although the project was briefly tested in other Georgia Southern Libraries (GSL) locations on the Statesboro campus and in the Learning Commons, this case analysis focuses solely on the whiteboard implemented at Lane Library.
Project Description
The initial pilot of the whiteboard (later named #ProjectWhiteboard by a GSL colleague), used a rolling whiteboard placed slightly back from the circulation desk. This placement allowed library employees to monitor the board and responses, while keeping it visible and accessible to students passing through. The first prompt (“What is your favorite thing about the library?”) received 15 responses after approximately a week. We interpreted the low response rate as a possible signal that the board’s proximity to the circulation desk increased the sense of being observed while responding. This led to the whiteboard being moved to the lobby of the library: near the entrance but not blocking the walkway, in a transitional space where students would gather to sit in the comfortable chairs, visit the vending machines or look at the flyers posted, in sight of the front desk, but not directly in front of it. After the whiteboard was moved, the average number of responses per question increased, which seemed to indicate moving it was the right decision. At the time of this writing, the whiteboard still stands in the Lane Library lobby, despite my relocation to Kennesaw State University.
The fall 2021 semester functioned as a pilot phase to determine whether students would respond consistently to the prompts and whether the prompts would generate useful insight. We focused early prompts on library experience and on students’ day-to-day realities (e.g., how they were feeling or what they were dealing with as part of their college experience). At the end of the semester, we asked the students if we should keep the whiteboard. Overwhelmingly, the students answered “yes,” which informed the decision to carry the project forward.
Over the years, the whiteboard itself evolved to distinguish it from the student-use rolling whiteboards. The initial whiteboard was smaller, lower to the ground, and had less space for students to respond to questions. Before the whiteboard returned for the fall 2022 semester, the library acquired additional rolling whiteboards for student use; a taller model with more surface area was repurposed for the project. We started writing #ProjectWhiteboard in the bottom left corner and placed a disclaimer in the lower-right corner to describe the project. By spring 2025, that whiteboard was a recognizable fixture in the lobby of Lane Library, and we looked for ways to distinguish it further from the student-use whiteboards that were around the library. We added decals with “Question of the Day” in the upper left-hand corner and “#ProjectWhiteboard” in the lower left-hand corner, and a notice not to erase or clean the board (see Figure 1).
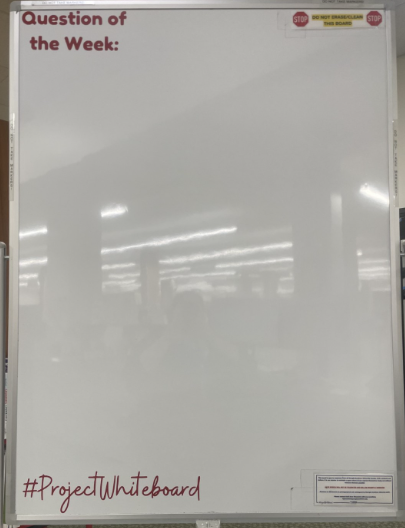 Fig. 1: Photo of the whiteboard used for #ProjectWhiteboard (photo taken by Kelli Anne Gecawich)
Questions & Responses
Over the course of the project, 118 questions were asked with approximately 8,713 responses provided. Because the whiteboard is public and erasable, this total should be understood as an estimate; some responses were likely lost when content was erased, overwritten, or altered by students passing through the space. Questions ranged from asking about the students’ feedback on the library to how they are feeling that week to what their favorite TV show was to whether a hot dog is a sandwich. Table 1 highlights the questions with the most responses for each semester of the project.
Table 1: Most Popular Questions by Semester for #ProjectWhiteboard
| Question | Responses |
|---|---|
| FALL 2021 | |
| Today I feel_______ | 85 |
| How are you doing? | 74 |
| What’s the hardest thing about college? | 72 |
| FALL 2022 | |
| What inspires you? | 122 |
| Today I feel_______ | 114 |
| Best comfort food | 110 |
| SPRING 2023 | |
| What’s your favorite song this week? | 108 |
| What’s something that’s made you happy today/this week? | 102 |
| What’s the best TV show ever? | 101 |
| FALL 2023 | |
| How are you doing today? | 106 |
| The title of your autobiography is the last TV show/book/song you watched/read/listened to. What is it? | 102 |
| If animals could talk, which one would be the rudest? | 101 |
| SPRING 2024 | |
| Thoughts on T. Swift’s new album(s)? | 134 |
| What is your favorite song at the moment? | 115 |
| What is something you wish you'd learned sooner? | 98 |
| FALL 2024 | |
| Is a hot dog a sandwich?* | 172 |
| What emoji are you today? | 115 |
| Is Bigfoot real? | 96 |
| What is the most common compliment people give you? | 96 |
| SPRING 2025 | |
| Write a number between 1 + 500 but it can’t be 1 someone else wrote* | 167 |
| What is your favorite animal? | 137 |
| What is the best type/form of potato? | 127 |
| FALL 2025 | |
| Why are you visiting the library today?* | 192 |
| Which is the best season: winter, spring, summer or fall? | 164 |
| Where are you coming from? | 159 |
*One of the top 3 overall performing questions throughout the duration of the project
Response rates tended to be higher to questions that were less serious and asked students about their lives and their experiences. However, when looking at the top performing questions, the question “Why are you visiting the library today” was the most answered question over the entire duration of the project. The number of responses included not just responses to the question being asked, but also times students responded to or agreed with each other’s answers to the questions. This contributed to the board becoming more of a conversation among the students, as well as an opportunity for library staff to get more insight into the patrons that we serve in the library.
Challenges
While the project was ultimately successful, it was not without challenges and learning opportunities. One recurring insight was that question wording meaningfully shaped both response volume and quality. During fall 2025, for example, we attempted to write a question in partnership with Georgia Southern’s IT department to gather feedback about IT services. The initial wording (“For better student success: how can ITS department improve? What services/programs could be added?”) led to minimal responses that did not align with the intent of the question; respondents wrote that they wanted free snacks, a nap room, and they had thoughts about the temperature in the library. The revised question (“For better student success: how can the IT department improve? What services/programs do you want to see?”) yielded responses that more closely aligned with the original intent of the question (wi-fi connectivity issues were the most prominent, which was not surprising since a new wi-fi network had been rolled out that semester and there were some growing pains), but some responses indicated that students used the whiteboard more as a space to vent their struggles with the institution rather than directly answer the question. This was one of the questions that yielded lower response rates over the semester, which may reflect both the question design and the extent to which the students felt motivated to respond.
The transitional and erasable nature of whiteboards also introduces an inherent data retention challenge. Responses can be lost if they are erased intentionally or accidentally, or if students decided to use the whiteboard for their studies. Lane Library experienced fewer issues with students repurposing the whiteboard for studying, but employees observed this problem more frequently at other locations, which became a factor that limited broader expansion of the project across Georgia Southern’s Library locations. It seemed that some responses to questions were erased by other students though it is not possible to determine whether this reflected disagreement, disruption, or accidental erasure.
Successes
As #ProjectWhiteboard became more of a fixture in Lane Library, response rates per question increased over time. In the first semester of the project (fall 2021) we posted 12 questions that averaged 44.42 responses per question. By fall 2025, my last semester at GSU, we posted 18 questions that averaged 102.33 responses per question, a 130.37% increase over the four years. Just as notably, the whiteboard became an expected part of the library and we frequently saw students stopping in the lobby to not only answer the prompts on the whiteboard, but also just spend time reading both sides of the board and discussing other students’ responses amongst themselves. I heard feedback from both library employees and students in the library about how much they enjoyed the whiteboard being there, and it was even featured on the university’s social media at the beginning of one of the fall semesters.
A second success was the extent to which students took the board and made it their own space. The questions generated candid responses about student concerns and student life, ranging from academic stress and the broader college experience to interpersonal relationships, gender, mental health, and current events. Students also engaged with other responses on the board rather than the prompt, and we even had students adding their own voting categories or drawings to questions (some students even saw fit to give us feedback on the question that we were asking that week). The whiteboard became a place for students to express themselves as honestly or goofily as they wanted, and a place for us as library employees to get to understand the students that we served just a little bit better.
Sticker Surveys for STEM Students
by Alyssa Kowis
Institutional Profile & Project Background
Kennesaw State University (KSU) is an R2 designated public university, with campuses located in Kennesaw and Marietta, Georgia. Sturgis Library serves the Kennesaw Campus and Johnson Library serves the Marietta Campus. KSU’s Marietta Campus, commonly referred to as the STEM Campus, has a documented history of being more challenging for campus partners to engage students in programs, events, and co-curricular activities. While the Marietta Campus is smaller than the Kennesaw Campus, it enrolls approximately 13,500 students (out of approximately 51,000 students in total). Because the Marietta Campus population and culture differ from the larger Kennesaw Campus, Johnson Library employees have made intentional efforts to learn more about STEM students’ needs, preferences, and engagement patterns.
Each semester KSU’s two libraries host a mix of shared events and campus-specific events. Both libraries start the fall term with Bash in the Stacks, an event that combines fun activities with helpful information about library services and support for academic work. On the Marietta Campus, Johnson Library has found greater success with targeted programming, such as company research workshops in advance of Career Fairs and data visualization related events during “Love Data Week.” Even with more targeted programming, students on the Marietta Campus still treated events as pass-through experiences rather than staying to engage or learn about events. That pattern prompted us to start a quest to better understand what Marietta Campus students actually want from the library and what they understand (or misunderstand) about our services and resources. While STEM students do use an abundance of online resources, STEM students at KSU frequently use the Johnson Library as their primary study space, which is limited on the Marietta Campus. Because of this, we decided to focus our assessment efforts of Marietta Campus students using in-person surveys in the Johnson Library.
Engagement Challenges and the Need for a New Approach
Inspired by other institutions’ successes with whiteboard surveys (including #ProjectWhiteboard at the Georgia Southern Libraries), Johnson Library piloted a whiteboard question initiative during spring 2023. Every Wednesday, we would post a new question and review responses the following morning. While participation was low, averaging less than 10 responses per question, the pilot initiative did reveal two important patterns. Students were more likely to respond when the board was in a central location near the library entrance, and participation tended to improve if we didn’t pose a question every week. Ultimately, we concluded that the primary barrier to participation was effort: students were unlikely to stop and write a response, even when the prompt was visible and engaging. To increase participation and make gathering feedback more useful, we had to pivot to a lower-effort model.
The pivot was informed by an observation from larger library events: students responded positively to stickers offered as souvenirs. Building on that insight, we combined the visibility of a whiteboard prompt with the ease of sticker voting, eliminating the need for open-ended writing. Rather than asking students to write responses directly on a board, we designed and printed poster-style questions with a small selection of answer choices that students could “vote” on. The project goals were threefold: (1) learn how Marietta Campus students prefer to interact with the library, (2) identify what students understand or misunderstand about library services, and (3) gather insights into what type of events, programs, or outreach approaches students would be most likely to engage with.
Implementing the sticker survey model required a small but intentional workflow. We developed a list of topics, expanded use of Canva for poster design, learned file formatting and sizing requirements for large-format printing, and selected and ordered sticker types suitable for repeated use. Posters were mounted on a large whiteboard in a high-traffic area, and strips of stickers were hung beside each poster. To reinforce the low-barrier nature of participation, posters included simple language such as “Place your sticker,” inviting students to respond as quickly—or as thoughtfully—as they wished before continuing on their way. We thought a more passive method might be more appealing to the students than the whiteboard survey, and it would allow us to gather more and better data.
Successes
The sticker survey model launched in fall 2024 and quickly produced substantially higher student participation than the earlier whiteboard pilot. Rather than averaging less than 10 written responses per question, sticker survey posters routinely generated more than 100 responses each. By fall of 2025, the project averaged 194 responses per poster across 21 posters, indicating that the lower effort “vote with a sticker” format successfully reduced a key participation barrier.
To sustain engagement over time while also collecting meaningful data, we developed a system of alternating between “fun” prompts and more explicitly academic or service-oriented questions. The initial prompt (“What do you game on?”, see Figure 2) served as a low-stakes way to confirm that students would participate, and to determine how long each poster could remain in place before interest tapered; in practice, posters typically remained active for approximately one week.
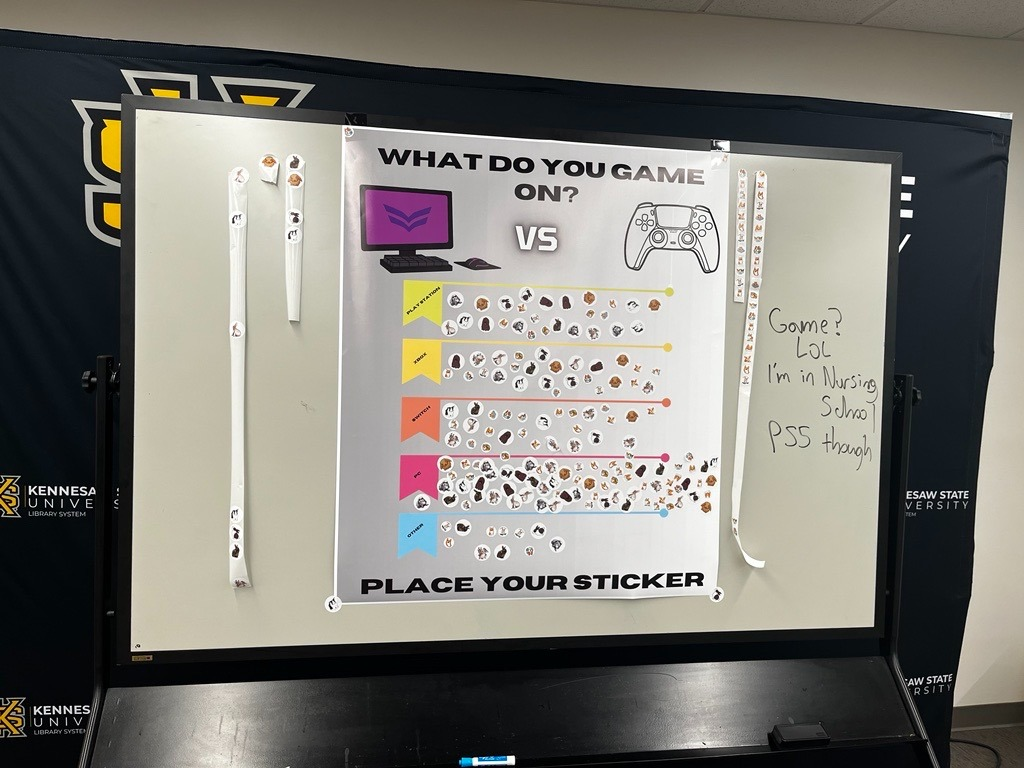 Fig. 2: Poster results for “What Do You Game On?” (Note, options for selection were Playstation, XBox, Switch, PC, and Other)
Once we had an established pattern of response from the students, we introduced prompts designed to inform library support for our students. One example—“Do you prefer to get help in-person or online?” (see Figure 3)—yielded a particularly useful (and unexpected) finding: although most research consultations were being conducted online, students indicated a preference for in-person help.
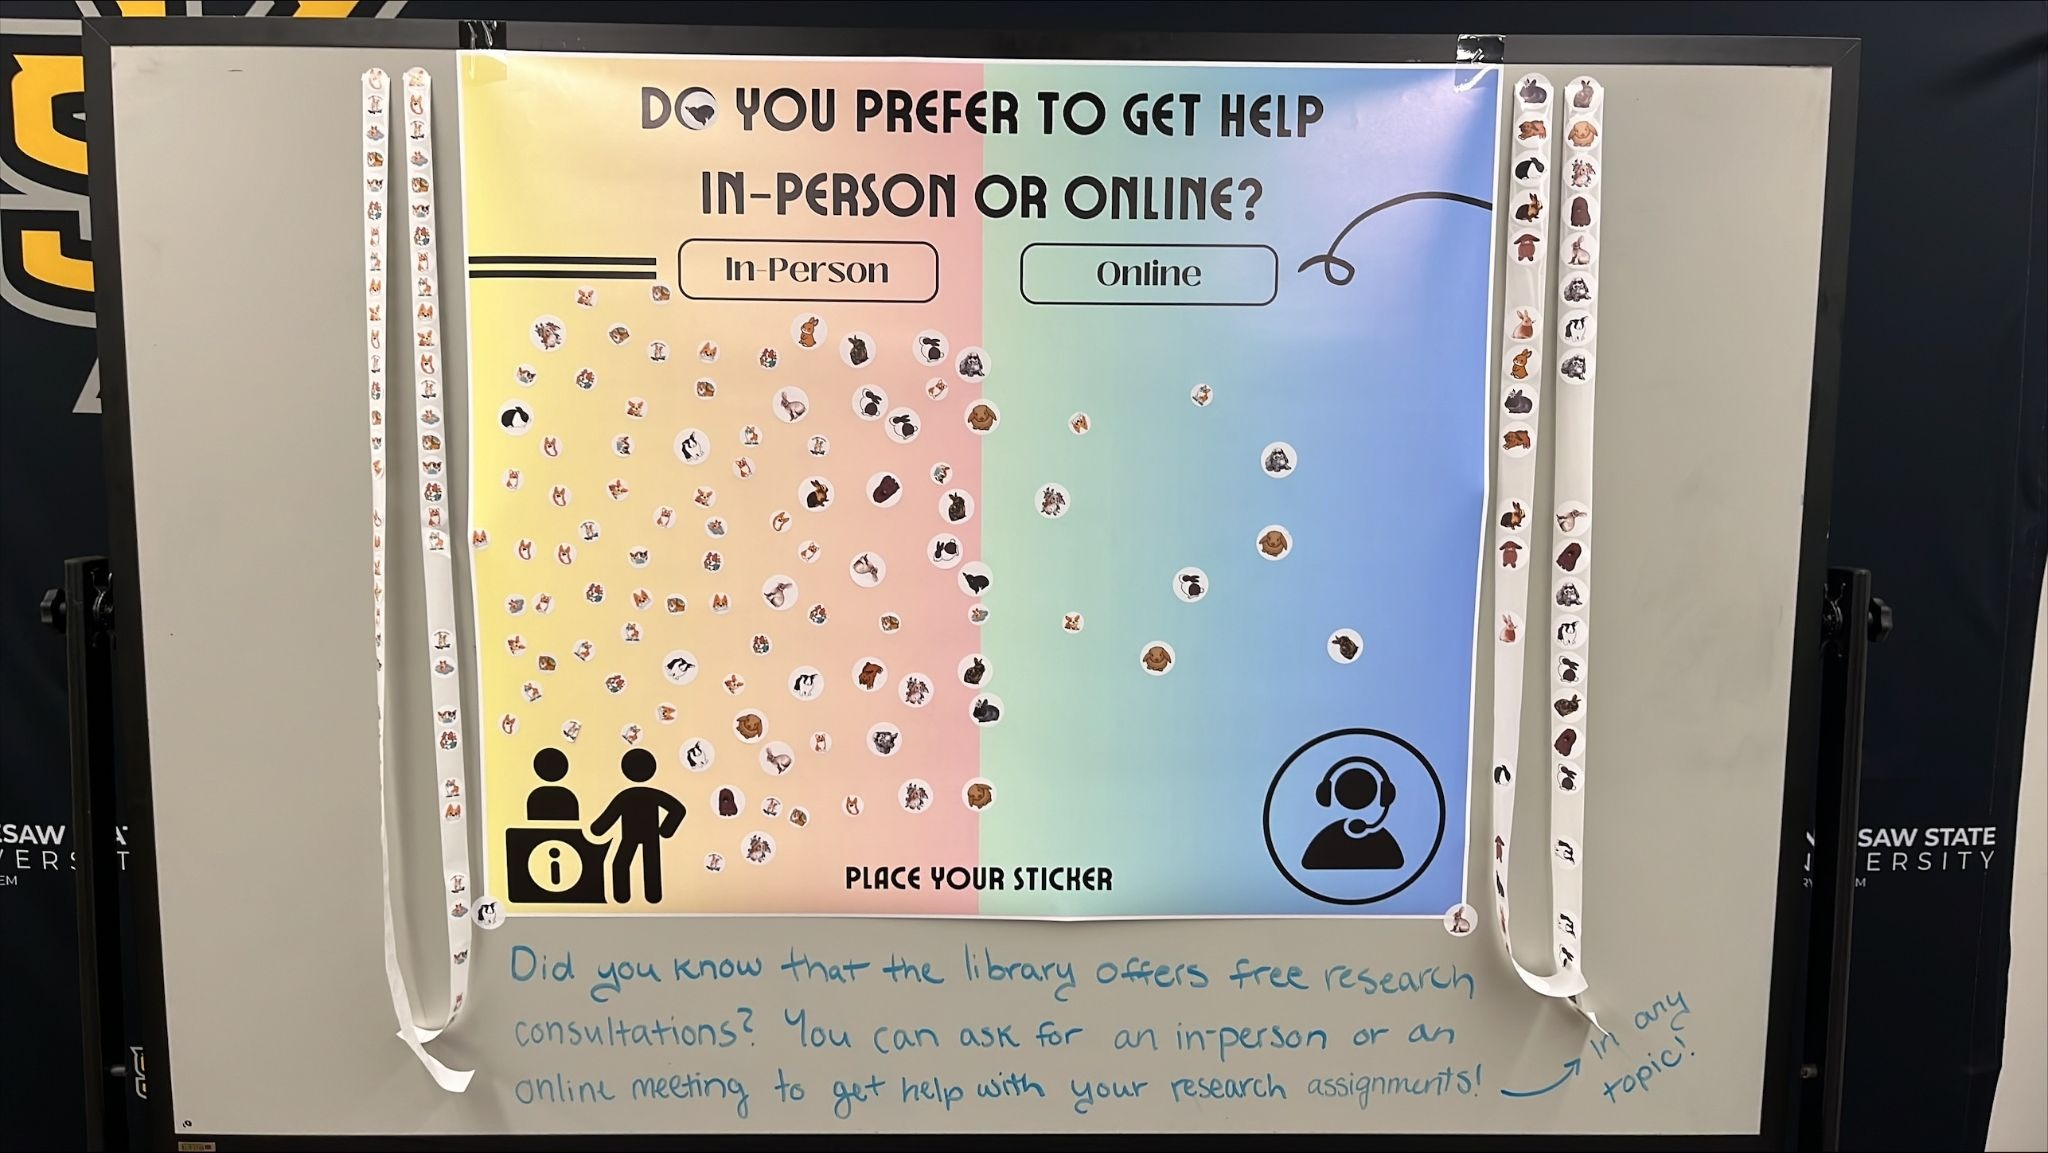 Fig. 3: Poster results for “Do you Prefer to Get Help In-Person or Online?”
While “fun” prompts have a higher average response rate (approximately 188 votes per poster) than academic prompts (approximately 167 responses per poster), academic prompts still generate robust responses (see Figure 4). The highest “fun” prompt received 364 votes and the highest academic prompt received 249 votes.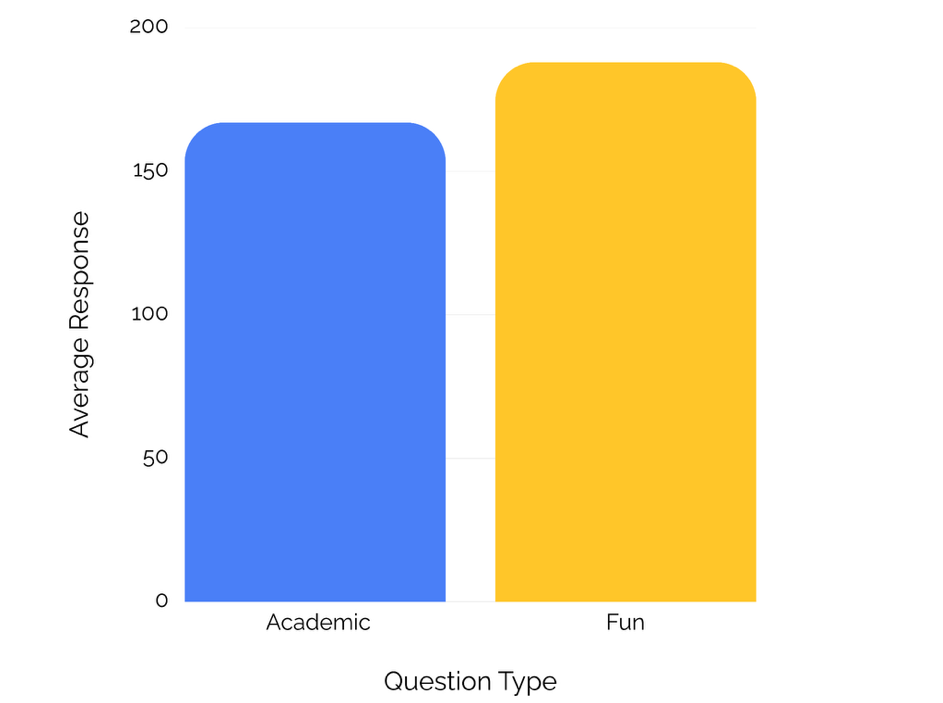 Fig. 4: Response rate for question types
Beyond participation counts, the surveys generated practical insight for the Academic Engagement & Instruction (AEI) unit, particularly for the two AEI librarians located on the Marietta Campus. Poster results suggested that many students identify as visual and kinesthetic learners (see Figure 5) and that library use peaks between 12–5 p.m. and again from 9–11 p.m. Responses also helped refine support priorities: when asked about finals week assistance, students overwhelmingly prioritized free food, while showing comparatively little interest in designated quiet‑study zones. When asked about preferred library spaces, students indicated a strong preference for study rooms and study carrels. These findings supported more intentional outreach and collaboration within the library and beyond, including stronger connections with colleagues in Academic Coaching. In addition, results helped the KSU Libraries Resource Strategy unit, who are responsible for collection development, better understand students’ preferred genres and formats for leisure reading. We also learned about the challenges that students face related to motivation and time management, which created opportunities to connect students with campus support resources.
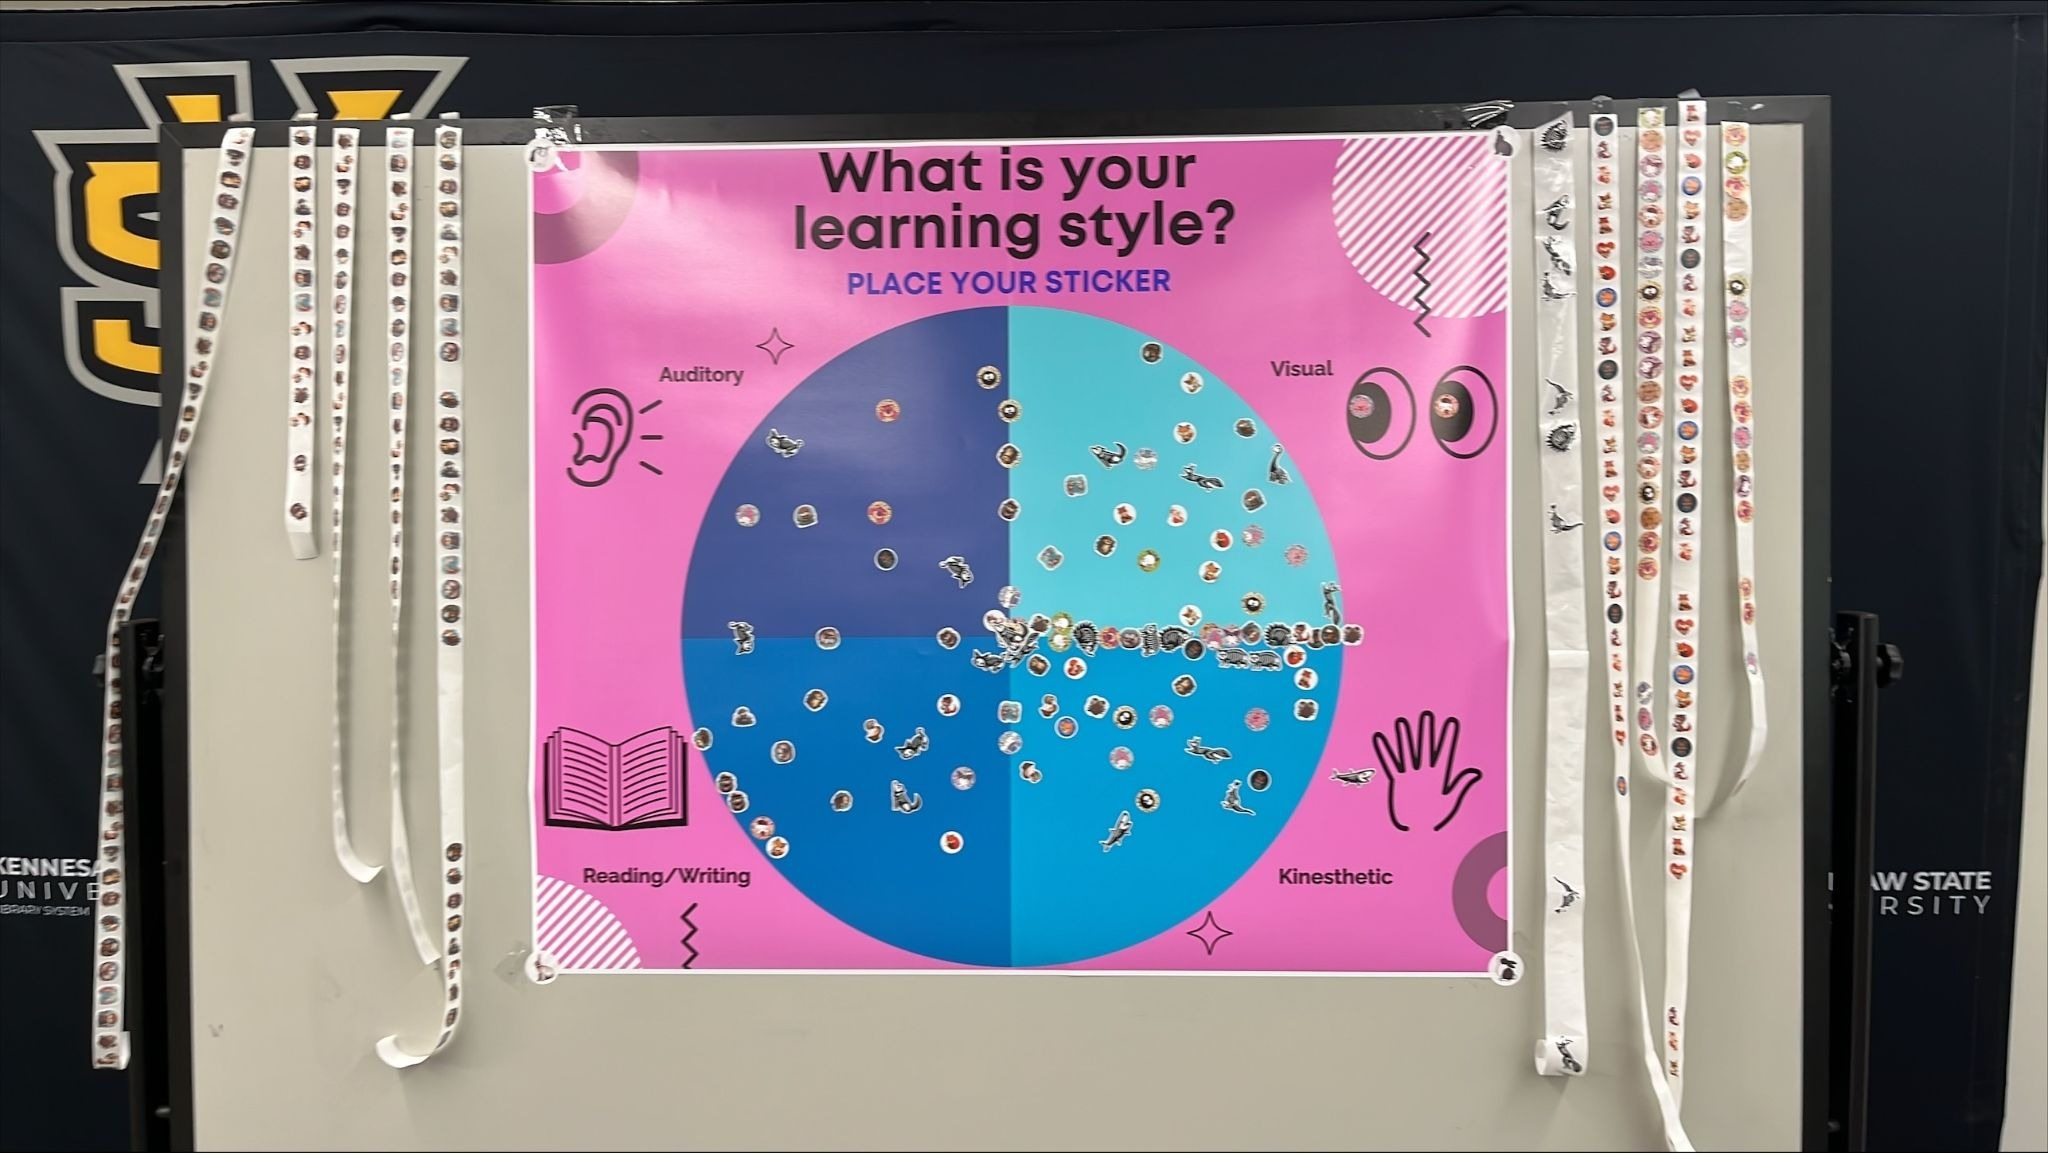 Fig. 5: Poster results for “What is your Learning Style?”
Trials, Errors, and Unexpected Results
After the sticker survey model demonstrated consistent participation, we started experimenting with variations to better understand what formats worked best for Marietta Campus students. One early adaptation was the addition of write-In options on select posters. In these versions, the poster provided multiple choice voting options alongside a blank space for students to add an answer that did not fit the preselected categories. For example, in a poster asking students to select their “academic superpower” 27 of the 173 total responses were contributed as write-ins, suggesting that students were willing to provide more open-ended feedback when the primary interaction remained low effort (see Figures 6 and 7). Students even voted on the write-in choices in the “Academic Superpower” poster.
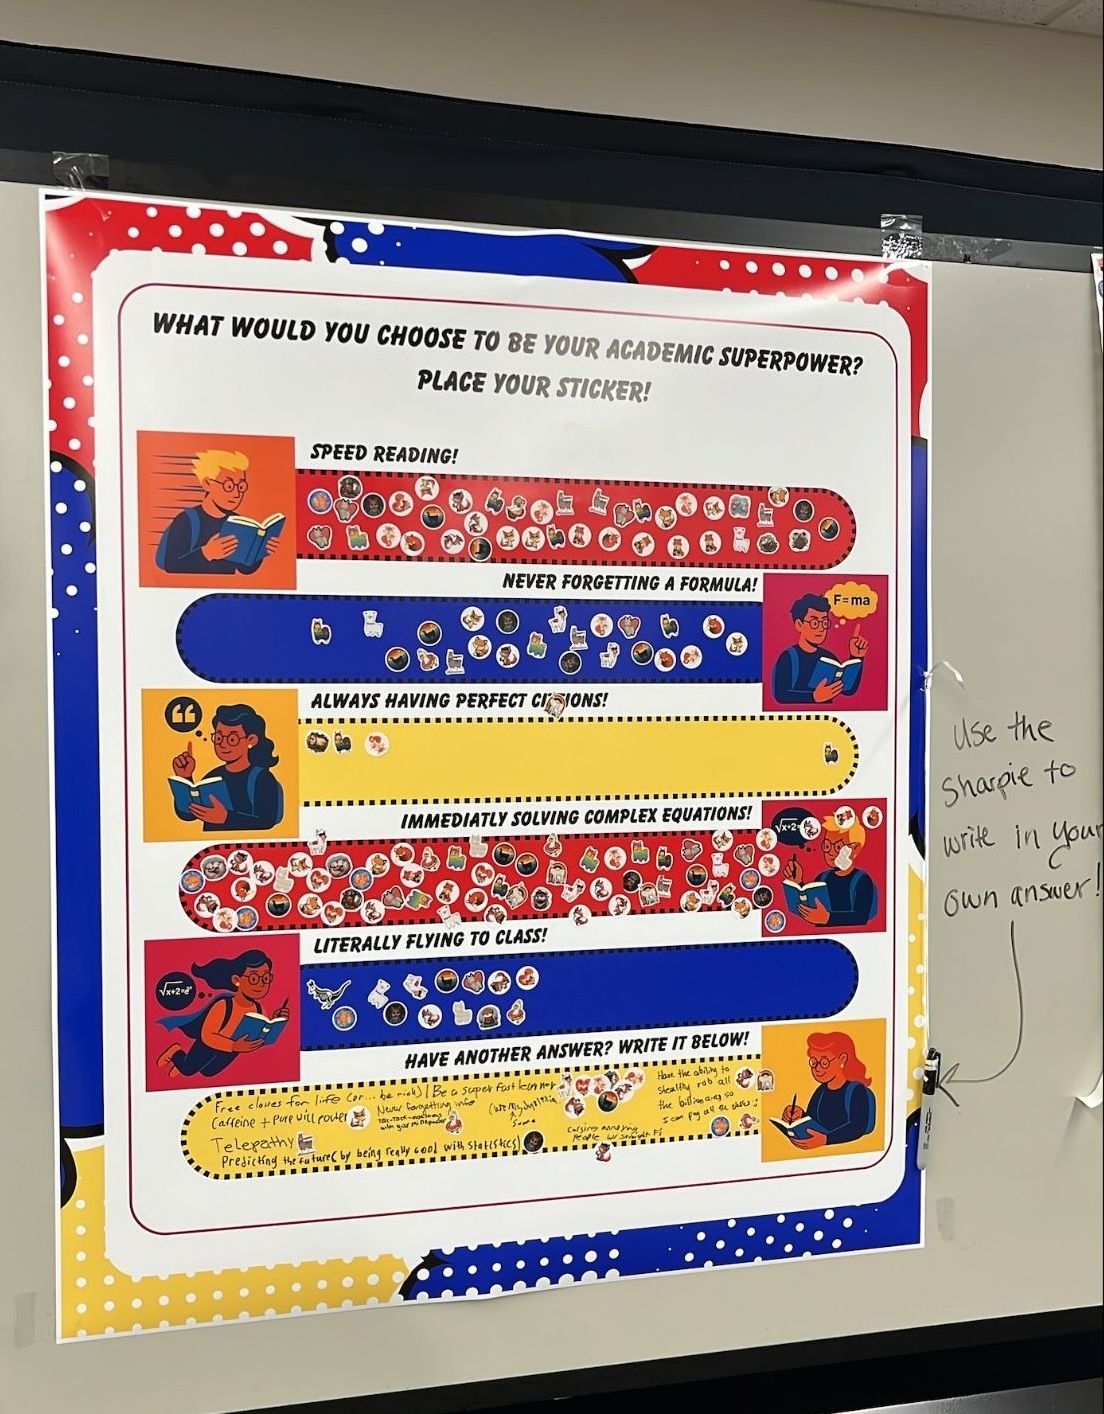 Fig. 6: Poster results for “What Would You Choose to be Your Academic Superpower?”
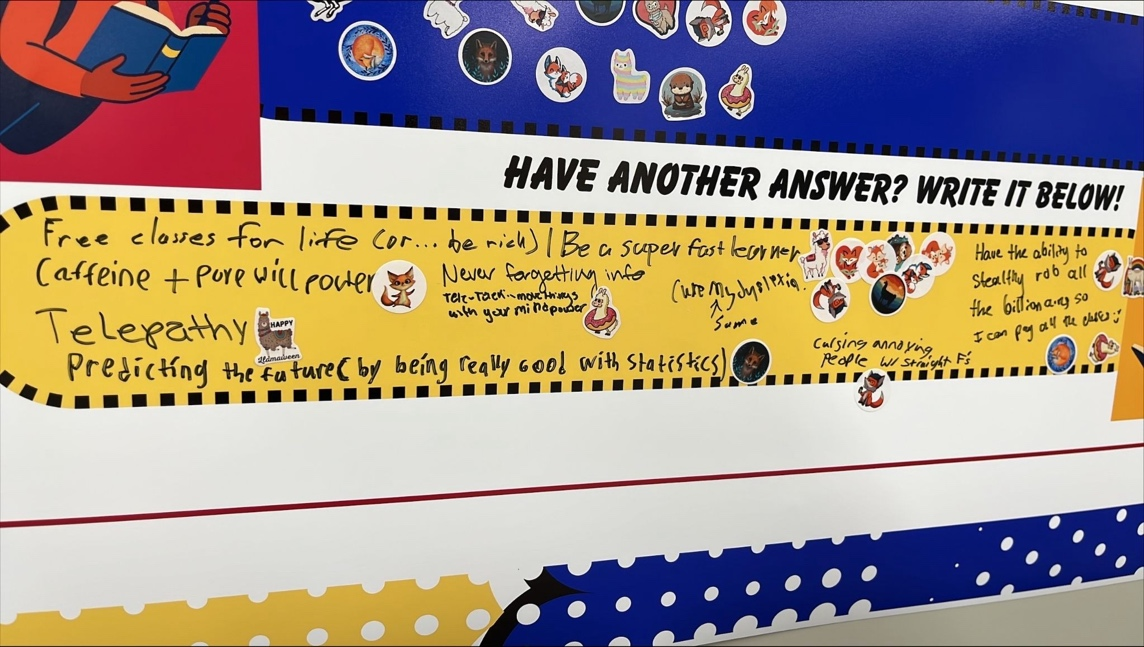 Fig. 6: Student Write-in Responses for “What Would You Choose to be Your Academic Superpower?” Note: Note: Write-in responses included the following: “Free classes for life (or…be rich);” “Be a super fast learner;” “Telepathy;” “Caffeine + pure will power;” “Predicting the future by being really good with statistics;” “Never forgetting info;” “Cursing annoying people with straight F’s”
Other experiments were less effective and helped clarify practical boundaries for format. In one iteration, we added a QR code to a poster to collect program ideas in a more detailed way. That approach only yielded one response, and it also revealed an unexpected vulnerability of the physical setup: a sticker placed directly on the QR code made the link unusable for any future submissions. We also piloted a “heat map” style poster, asking students to put a sticker on their favorite study spots on campus, paired with a write-in area. While the poster attracted very strong engagement, sticker stacking made it difficult to generate an accurate response count, limiting its usefulness for quantitative tracking.
As the project matured, sticker-based engagement also expanded beyond the passive whiteboard display into more intentionally social programming. We developed “Lounging with Librarians” an outdoor, low-pressure engagement event where the two AEI librarians based on the Marietta Campus hosted playful, debate-style sticker voting prompts (e.g., “What superpower would you rather have, invisibility or teleportation?” or, “Pizza or pasta?”). The format created natural opportunities for informal, casual conversations and relationship building between librarians and students, while preserving the low-barrier participation model. During the 2025-2026 academic year, we ran five “Lounging with Librarians” events, averaging around 76 responses per event.
The largest format experiment was a long-form, bracket-style tournament titled “Anime Madness.” We created a 64-entry bracket filled with popular and classic anime shows, seeded into regions and structured weekly voting cycles. The tournament ran from March 17-May 1, 2025 with daily matchups Monday through Thursday, and weekly bracket updates on Fridays. Over the course of the program, students cast 2,528 votes, demonstrating that the sticker format could sustain engagement across a multi-week arc when the structure was clear and the content resonated with student interests. Based on participation, we repeated the tournament in spring 2026, but with a new theme—video games—while keeping the same timeframe and format. This year, students cast 3,653 votes for their favorite video games.
One of the most notable (and affirming) outcomes of the sticker survey project has been the extent to which students have treated the posters as participatory spaces rather than fixed instruments. Students have occasionally added their own categories, sometimes even printing and contributing a new option when none of the answers fit their experience. For example, on the poster, “What’s Your Favorite Scary Franchise?” a student added their own option, acknowledging they could not comfortably engage with scary movies; that student-generated category then received its own set of votes (see Figure 8).
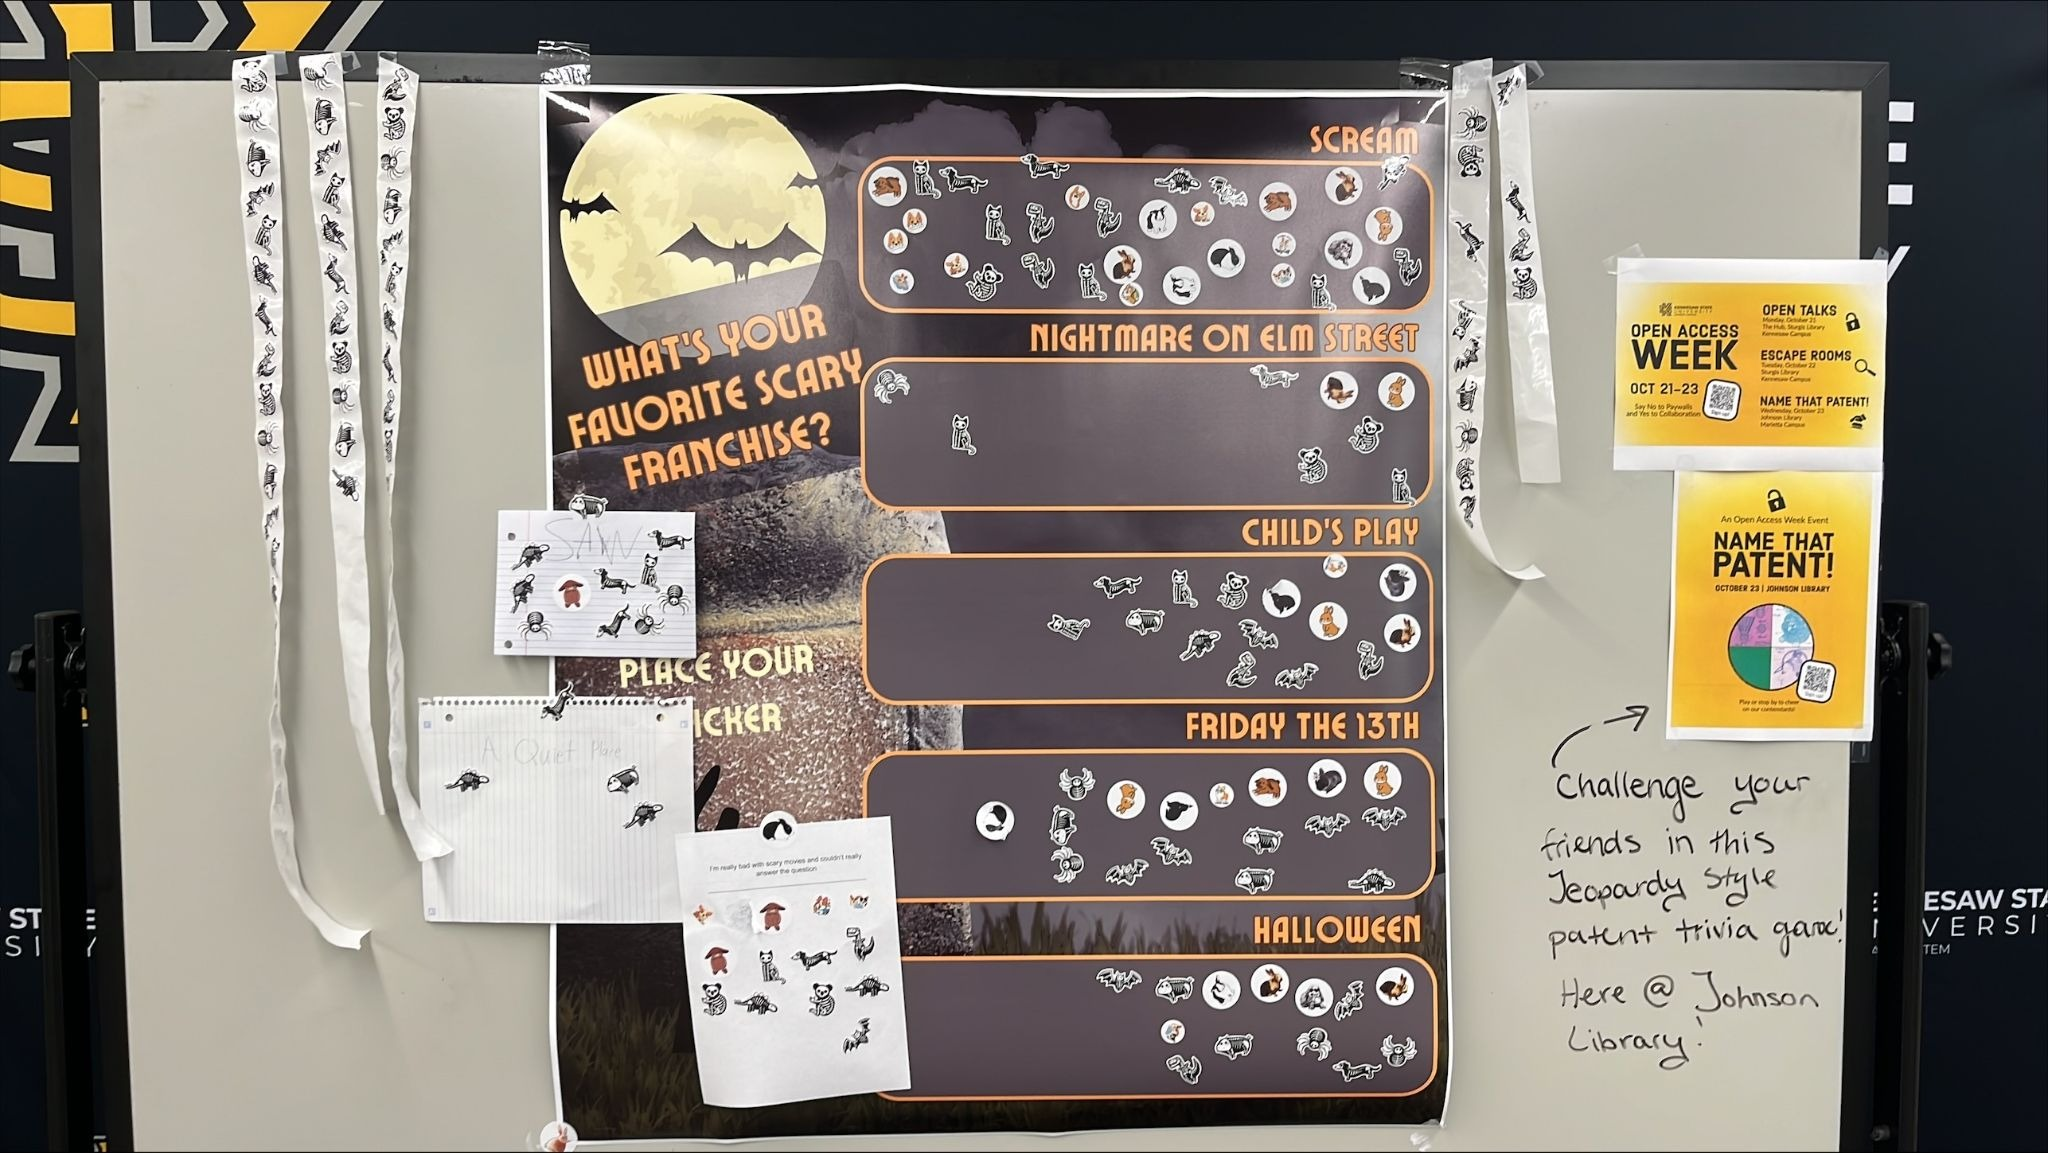 Fig. 8: “What’s Your Favorite Scary Franchise?” Poster
While most of our student-added categories are in good fun, we received some constructive criticism from a student on the environmental impact of using AI generated images in our poster design. We took that feedback seriously, and we have discontinued all AI-generated artwork on our posters. These moments reinforce a central observation across the project: low-barrier formats can do more than collect preferences. They can open an ongoing channel for student voice, critique, and co-creation that deepens the library’s understanding of what students notice, value, and want from their campus library.
Overall, the transition from whiteboard surveys to sticker based engagement formats has strengthened the library’s connection with students on the Marietta Campus. Beyond generating high participation rates, the initiative has opened new channels of communication, provided actionable insights, and fostered meaningful collaboration. The evolving model continues to demonstrate that thoughtfully designed, low‑barrier engagement strategies can meaningfully enhance student participation in environments where traditional methods have struggled.
Takeaways
Passive engagement created opportunities to learn about our students in ways that traditional library outreach and engagement do not always capture. Through low-pressure prompts, students shared not only library-related feedback, but also gave us glimpses into their interests, academic challenges, preferences, frustrations, and moments of joy. Additionally, this type of passive engagement develops natural connections between the library and the students, transforming a passive endeavor into a more active form of engagement. These responses helped us better understand what students were experiencing and what kinds of services, spaces, resources, and support might meet them where they are.
Utilizing passive engagement can be useful as a form of micro-assessment for the library as well, even if it is not “dressed up” as assessment. The interactive, creative nature of passive engagement initiatives allows us to couch assessment-type questions inside creative questions that can still provide useful feedback on the library and its services. Asking students to respond to a question about why they’re visiting the library can yield information on what services and resources are most important to them, just as asking about their learning styles can assist instruction librarians in designing instruction that will more closely align with how students like to learn and absorb information. While these methods should not replace more formal assessment, they can provide timely, directional insight that informs collections, instruction, outreach, and cross-campus partnerships.
Perhaps, most importantly, both case studies show that low-barrier engagement can help academic libraries communicate with students who may not respond to more traditional methods. Students appreciated having pre-selected options, but they also used (or created their own) open-ended opportunities when they wanted to add nuance, humor, or critique. Fun questions helped keep the communication channel open, making students more likely to respond when the library asked more practical or service-oriented questions. Through trial and error, and adaptation, these projects became more than passive displays; they became ongoing, asynchronous conversations between the library and students, and even among students themselves. The next challenge is determining how to grow these efforts while preserving the ease, playfulness, and low-pressure participation that made them successful in the first place.
References
Bastone, Z. (2020). Creating an outreach plan that accounts for the seen and unforeseen. Journal of Library Outreach and Engagement, 1(1), Article 1. https://doi.org/10.21900/j.jloe.v1i1.471
Biddle, C., & Gowen, E. (2023). STEM outreach activities in academic libraries: Planning strategies, COVID’s impact, and future considerations. Journal of Library Outreach and Engagement, 3, 69–91. https://doi.org/10.21900/j.jloe.v3.1188
Blummer, B., & Kenton, J. M. (2019). Academic libraries’ outreach efforts: Identifying themes in the literature. Public Services Quarterly, 15(3), 179–204. https://doi.org/10.1080/15228959.2019.1592058
Borrego, P., Graham, A., Lutz, E., Radik, M., & Reznik-Zellen, R. (2020). Curiosity as outreach: Flipping outreach on its head. Issues in Science and Technology Librarianship, 2020(94). https://doi.org/10.29173/istl54
Camacho, L., Wages, B., & Harris, T. (2020). The ultimate survey: Asking one question at a time to get feedback from library users. Reference Librarian, 61(1), 1–14. (141377196). https://doi.org/10.1080/02763877.2019.1642289
Clement, K. (2024). Intentionally equitable: Translating the Universal Design for Learning principles to academic library outreach. Journal of Library Outreach and Engagement, 4(1), 61–81. https://doi.org/10.21900/j.jloe.v4.1395
Del Bosque, D., Mitola, R., Skarl, S., & Heaton, S. (2017). Beyond awareness: Improving outreach and marketing through user surveys. Reference Services Review, 45(1), 4–17. https://doi.org/10.1108/RSR-02-2016-0009
Diaz, S. A. (2019). Outreach in academic librarianship: A concept analysis and definition. The Journal of Academic Librarianship, 45(3), 184–194. https://doi.org/10.1016/j.acalib.2019.02.012
Duong, K. (2010). Rolling out zotero across campus as a part of a science librarian’s outreach efforts. Science & Technology Libraries, 29(4), 315–324. https://doi.org/10.1080/0194262X.2010.523309
Facts & figures. Georgia Southern University. (2026). https://www.georgiasouthern.edu/offices/institutional-research/facts-and-figures
Farrell, S., & Mastel, K. (2016). Considering outreach assessment: Strategies, sample scenarios, and a call to action. In the Library with the Lead Pipe. https://www.inthelibrarywiththeleadpipe.org/2016/considering-outreach-assessment-strategies-sample-scenarios-and-a-call-to-action/
Flash, K., Allen, M., Mack, T., & Clement, K. (2017). STEM bridges: Evolution of an academic library STEM outreach program. Journal of Library Administration, 57(8), 879–890. (125942024). https://doi.org/10.1080/01930826.2017.1374105
Gecawich, K. A. (2024). Writing our story: Community building in an academic library using portable whiteboards. Endnotes: The Journal of the New Members Round Table, 12(1), 47–55. https://journals.ala.org/index.php/endnotes/article/view/8237
Mehta, P., & Cox, A. (2021). At home in the academic library? A study of student feelings of “homeness”. New Review of Academic Librarianship, 27(1), 4–37. (150146303). https://doi.org/10.1080/13614533.2018.1547774
Metzger, R., & Jackson, J. M. (2022). Developing competencies for outreach work in academic libraries. College & Research Libraries, 83(4), 646–668. https://doi.org/10.5860/crl.83.4.646
Oakleaf, M. J. (with Association of College and Research Libraries, & American Library Association). (2010). The value of academic libraries: A comprehensive research review and report. Association of College and Research Libraries, American Library Association. https://acrl.ala.org/value/?page_id=21
Owens, T. M. (2019). Amplify your impact: Going no-tech, low-tech, and high-tech: interactive library spaces as passive outreach. RUSQ: A Journal of Reference and User Experience, 59(1), 17–22. https://doi.org/10.5860/rusq.59.1.7221
Pruneda, K., Wilson, A., & Riedmueller, J. (2017). Writing on the walls: Engaging students through whiteboards. College & Research Libraries News, 78(5), 255. https://doi.org/10.5860/crln.78.5.255
Sandelli, A., & Cunningham, S. J. (2019). Ethnography in Student-Owned Spaces: Using Whiteboards to Explore Learning Communities and Student Success. New Review of Academic Librarianship, 25(2–4), 424–445. (141314691). https://doi.org/10.1080/13614533.2019.1616308